
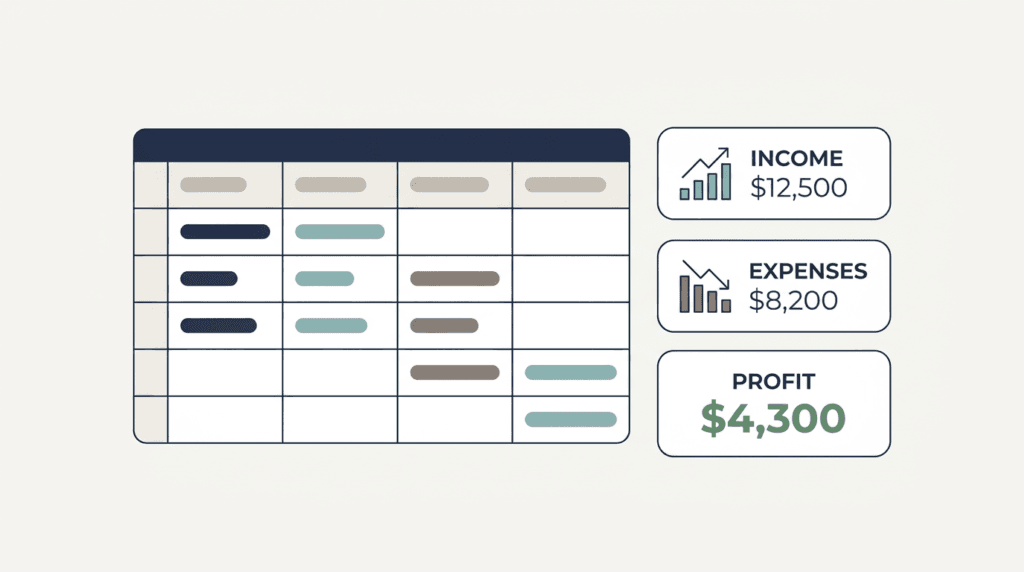
A monthly profit and loss in Google Sheets should fit on one screen. If you have to scroll, you have built a bookkeeping system, and you will stop updating it by March. This is the version that survives: one tab, twelve month columns, about twelve rows, and three numbers you read in under a minute.
Built this way, a monthly profit and loss in Google Sheets takes about twenty minutes to update and nothing to maintain. It is not a statutory profit and loss account. It will not satisfy an accountant at year end and it is not meant to. It answers a different question — did this month work? — early enough for the answer to change what you do next month.
Table of Contents
ToggleWhat this guide covers
- How the sheet is laid out
- Why there are two revenue rows
- The four formulas
- The three numbers that decide the month
- Where each figure comes from
- The free template
How the monthly profit and loss in Google Sheets is laid out
Column A holds the line names. Columns B to M are Jan to Dec. Column N is the year total. That is the entire layout.
| Row | Line | Type |
|---|---|---|
| 2 | Revenue invoiced | Typed |
| 3 | Revenue collected | Typed |
| 5 | Materials and stock | Typed |
| 6 | Subcontractors | Typed |
| 7 | Salaries and wages | Typed |
| 8 | Rent and utilities | Typed |
| 9 | Transport and fuel | Typed |
| 10 | Software and subscriptions | Typed |
| 11 | Marketing | Typed |
| 12 | Everything else | Typed |
| 13 | Total expenses | Formula |
| 15 | Profit on paper | Formula |
| 16 | Profit in the bank | Formula |
| 17 | Collection rate | Formula |
Two revenue rows, not one
This is the only unusual thing in the sheet and the reason to build it at all. Most profit and loss templates in Google Sheets have a single revenue line, which quietly assumes that invoicing and being paid are the same event. For a small firm they are not, and the gap between them is where businesses fail while showing a profit.
Row 2 is what you billed. Row 3 is what actually arrived in the bank. Keeping them apart costs you one extra number a month and tells you something no single-line template can.
The four formulas
Total expenses, in B13:
=SUM(B5:B12)
Profit on paper, in B15:
=B2-B13
Profit in the bank, in B16:
=B3-B13
Collection rate, in B17:
=IF(B2=0,"",B3/B2)
Format row 17 as a percentage using the number formatting options in Google Sheets. Then select B2:N17 and drag right so every month carries the same formulas. Column N is simply =SUM(B2:M2) dragged down, skipping the blank rows.
Everything above is setup. What follows is the part of a monthly profit and loss in Google Sheets that you are actually meant to read.
The three numbers in your monthly profit and loss that actually matter
- Profit in the bank. If row 16 is negative while row 15 is positive, you had a good trading month and a bad cash month. That is not a small distinction; it is the one that closes businesses.
- Collection rate. Under 80% for two consecutive months means your problem is not sales. It is collection, and it belongs in the pending payments sheet, not in a marketing plan.
- Largest expense line. Not the total. The biggest single row. Most owners can name their revenue to the rupee and guess their largest cost wrong.
One colour rule
Select B16:M16, Format, Conditional formatting, Format cells if: Less than, enter 0, fill light red. One rule, on one row. A P&L covered in colour is read the way a cluttered dashboard is read — which is to say, not at all.
A monthly profit and loss in Google Sheets is only as honest as the figures you feed it, so each line needs a fixed source.
Where the numbers come from
You should not be typing these from memory or from your bank app. Each line has a source:
- Revenue invoiced — the month total from your invoice log.
- Revenue collected — the sum of invoices whose date paid falls in that month, from the same log.
- Expenses — your bank statement, read once a month, top to bottom. Not receipts, not memory. The statement is the only record that cannot flatter you.
If a transaction genuinely does not fit any of the eight expense lines, it goes in Everything else. If Everything else exceeds about 10% of total expenses, you need a ninth line — but add it once, in December, not in a panic in June.
Eight expense lines and no more
Every accounting package offers you a chart of accounts with two hundred entries. Resist. The value of a monthly P&L is entirely in whether you fill it in, and filling it in takes twenty minutes with eight categories and two hours with forty. Twenty minutes gets done twelve times a year. Two hours gets done twice.
If you later move to proper software, these eight lines map cleanly onto a real chart of accounts, and you will already know what your cost structure looks like — which is more than most firms bring to their first bookkeeping engagement. If you later move to software, the same eight buckets map onto a standard chart of accounts with almost no rework.
Twenty minutes a month to keep the profit and loss honest
- Open your bank statement for the closed month.
- Read every line and put it in one of eight buckets. No skipping, no "I'll remember that one".
- Pull the two revenue figures from the invoice log.
- Read rows 15, 16 and 17 and say the collection rate out loud.
- If row 16 is red, write one sentence somewhere about what you will do differently. One sentence, not a plan.
The free monthly profit and loss Google Sheets template
Build your monthly profit and loss in Google Sheets from the table above. It is twelve rows and four formulas and you will understand it completely, which is the point — a P&L you did not build is a P&L you will not question. If you would rather have it built from your own bank statements, with twelve months of history categorised and the opening picture already drawn, message me from the contact page.
The sheet that works is the one still being filled in next December. Everything in this design — one tab, eight categories, three numbers — exists to make that likely rather than impressive.